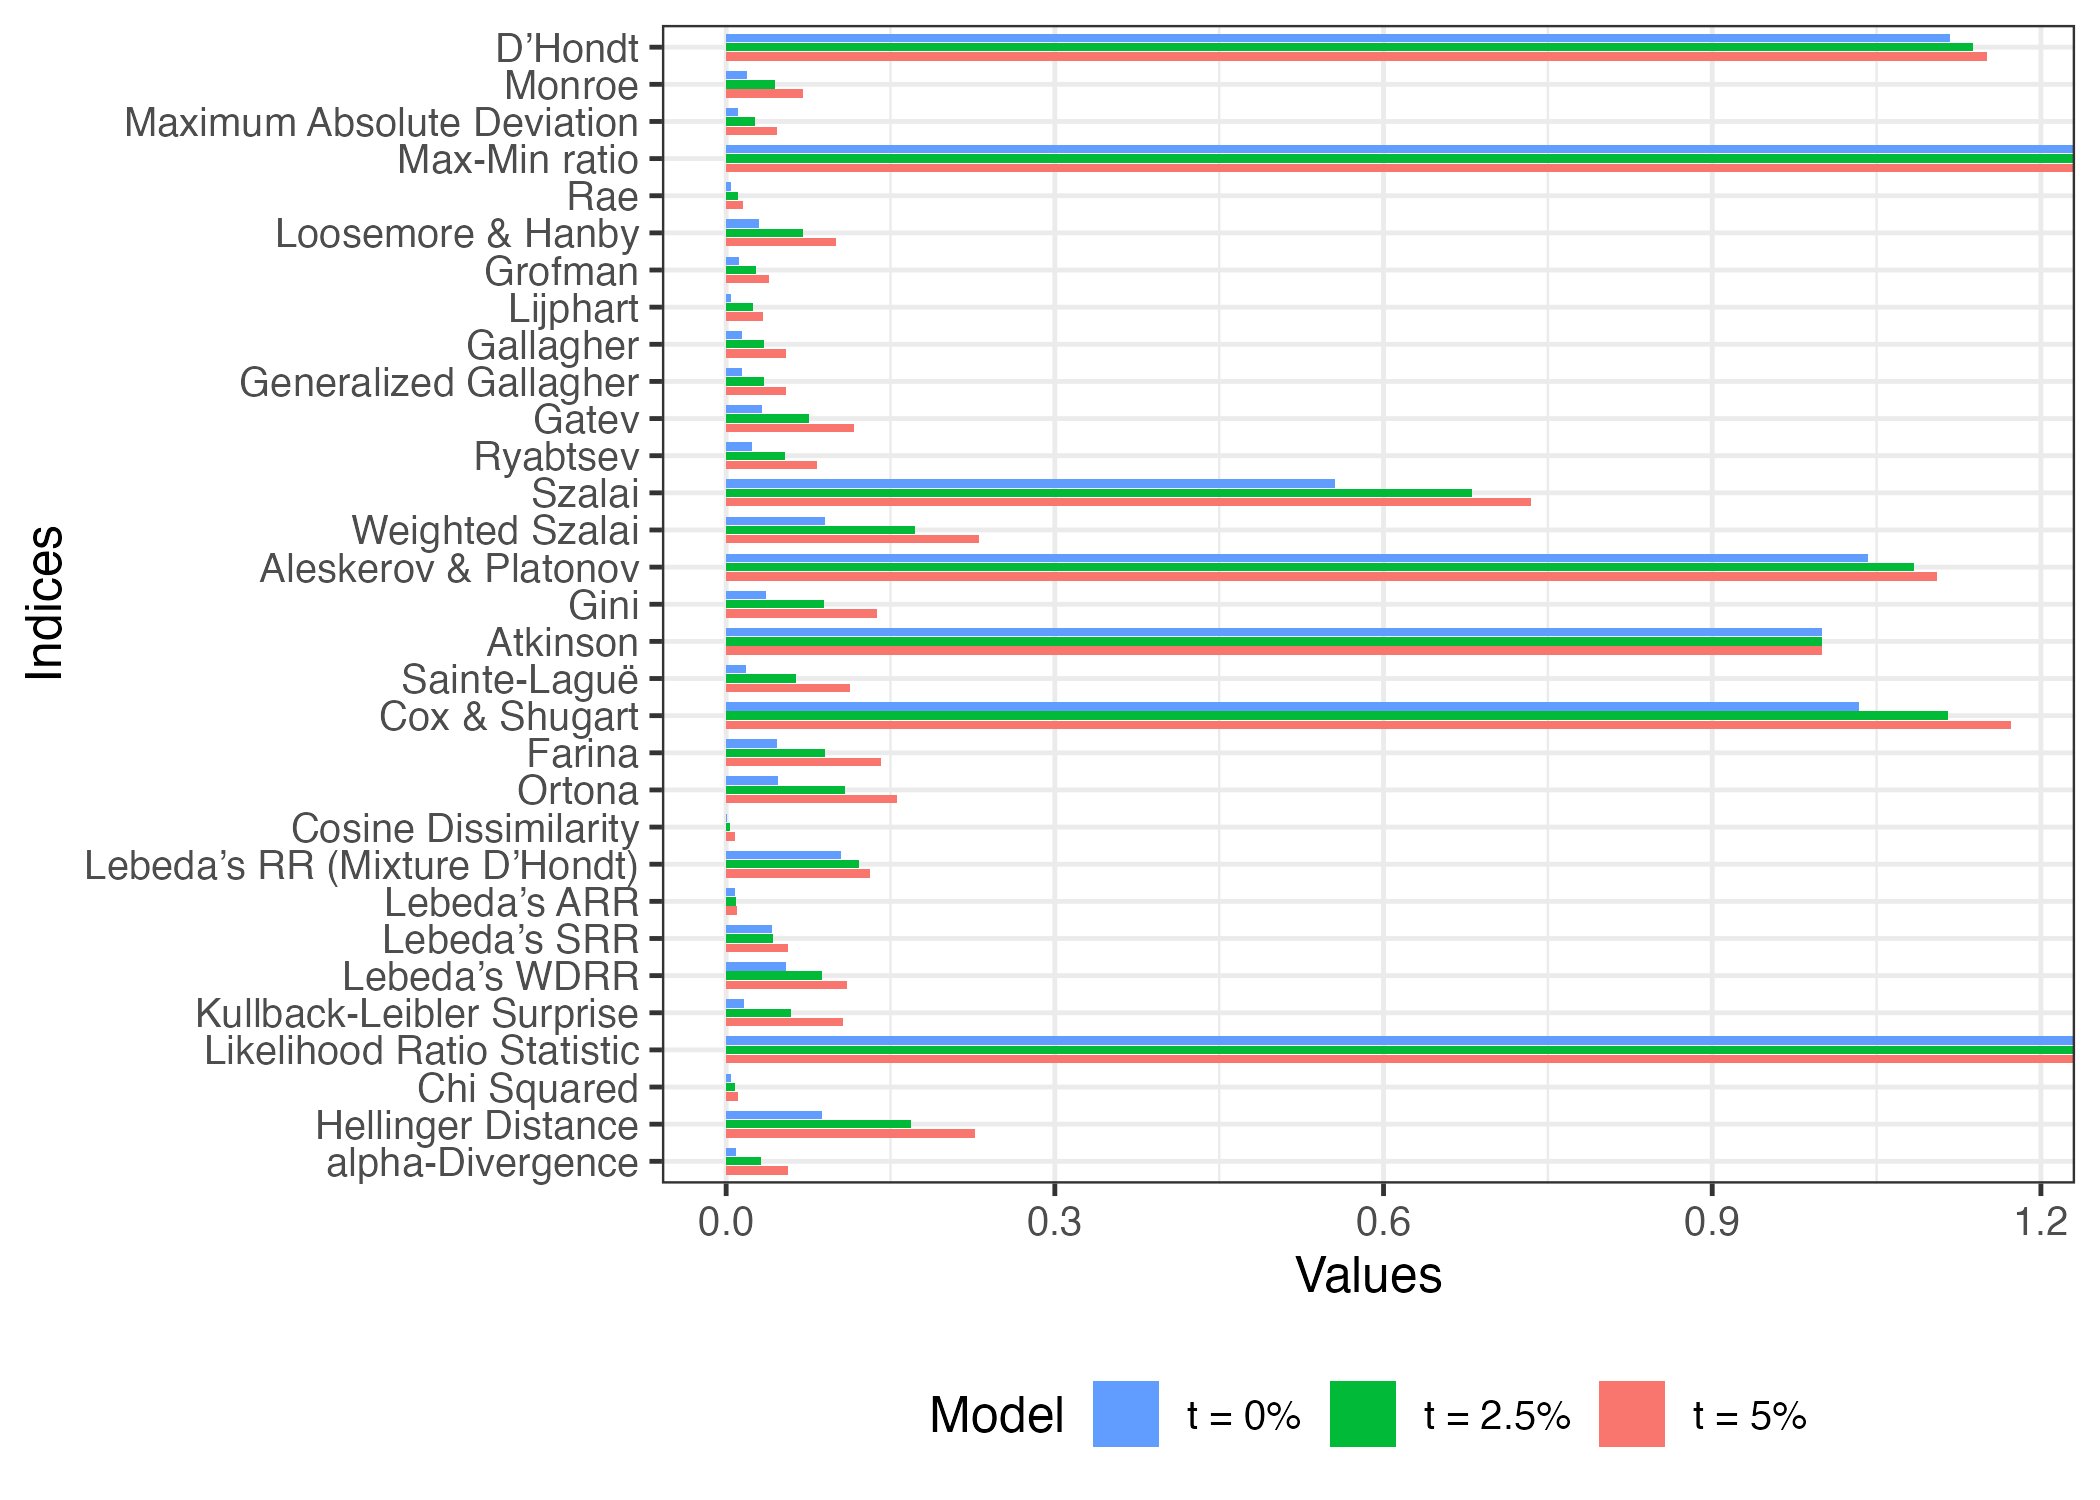
library(PRcalc)

data(jp_upper_2019)

pr_obj1 <- prcalc(jp_upper_2019, m = 50, method = "dt")
pr_obj2 <- prcalc(jp_upper_2019, m = 50, method = "dt", threshold = 0.025)
pr_obj3 <- prcalc(jp_upper_2019, m = 50, method = "dt", threshold = 0.05)

list("t = 0%"   = index(pr_obj1),
     "t = 2.5%" = index(pr_obj2),
     "t = 5%"   = index(pr_obj3)) |>
  compare() |>
  plot()
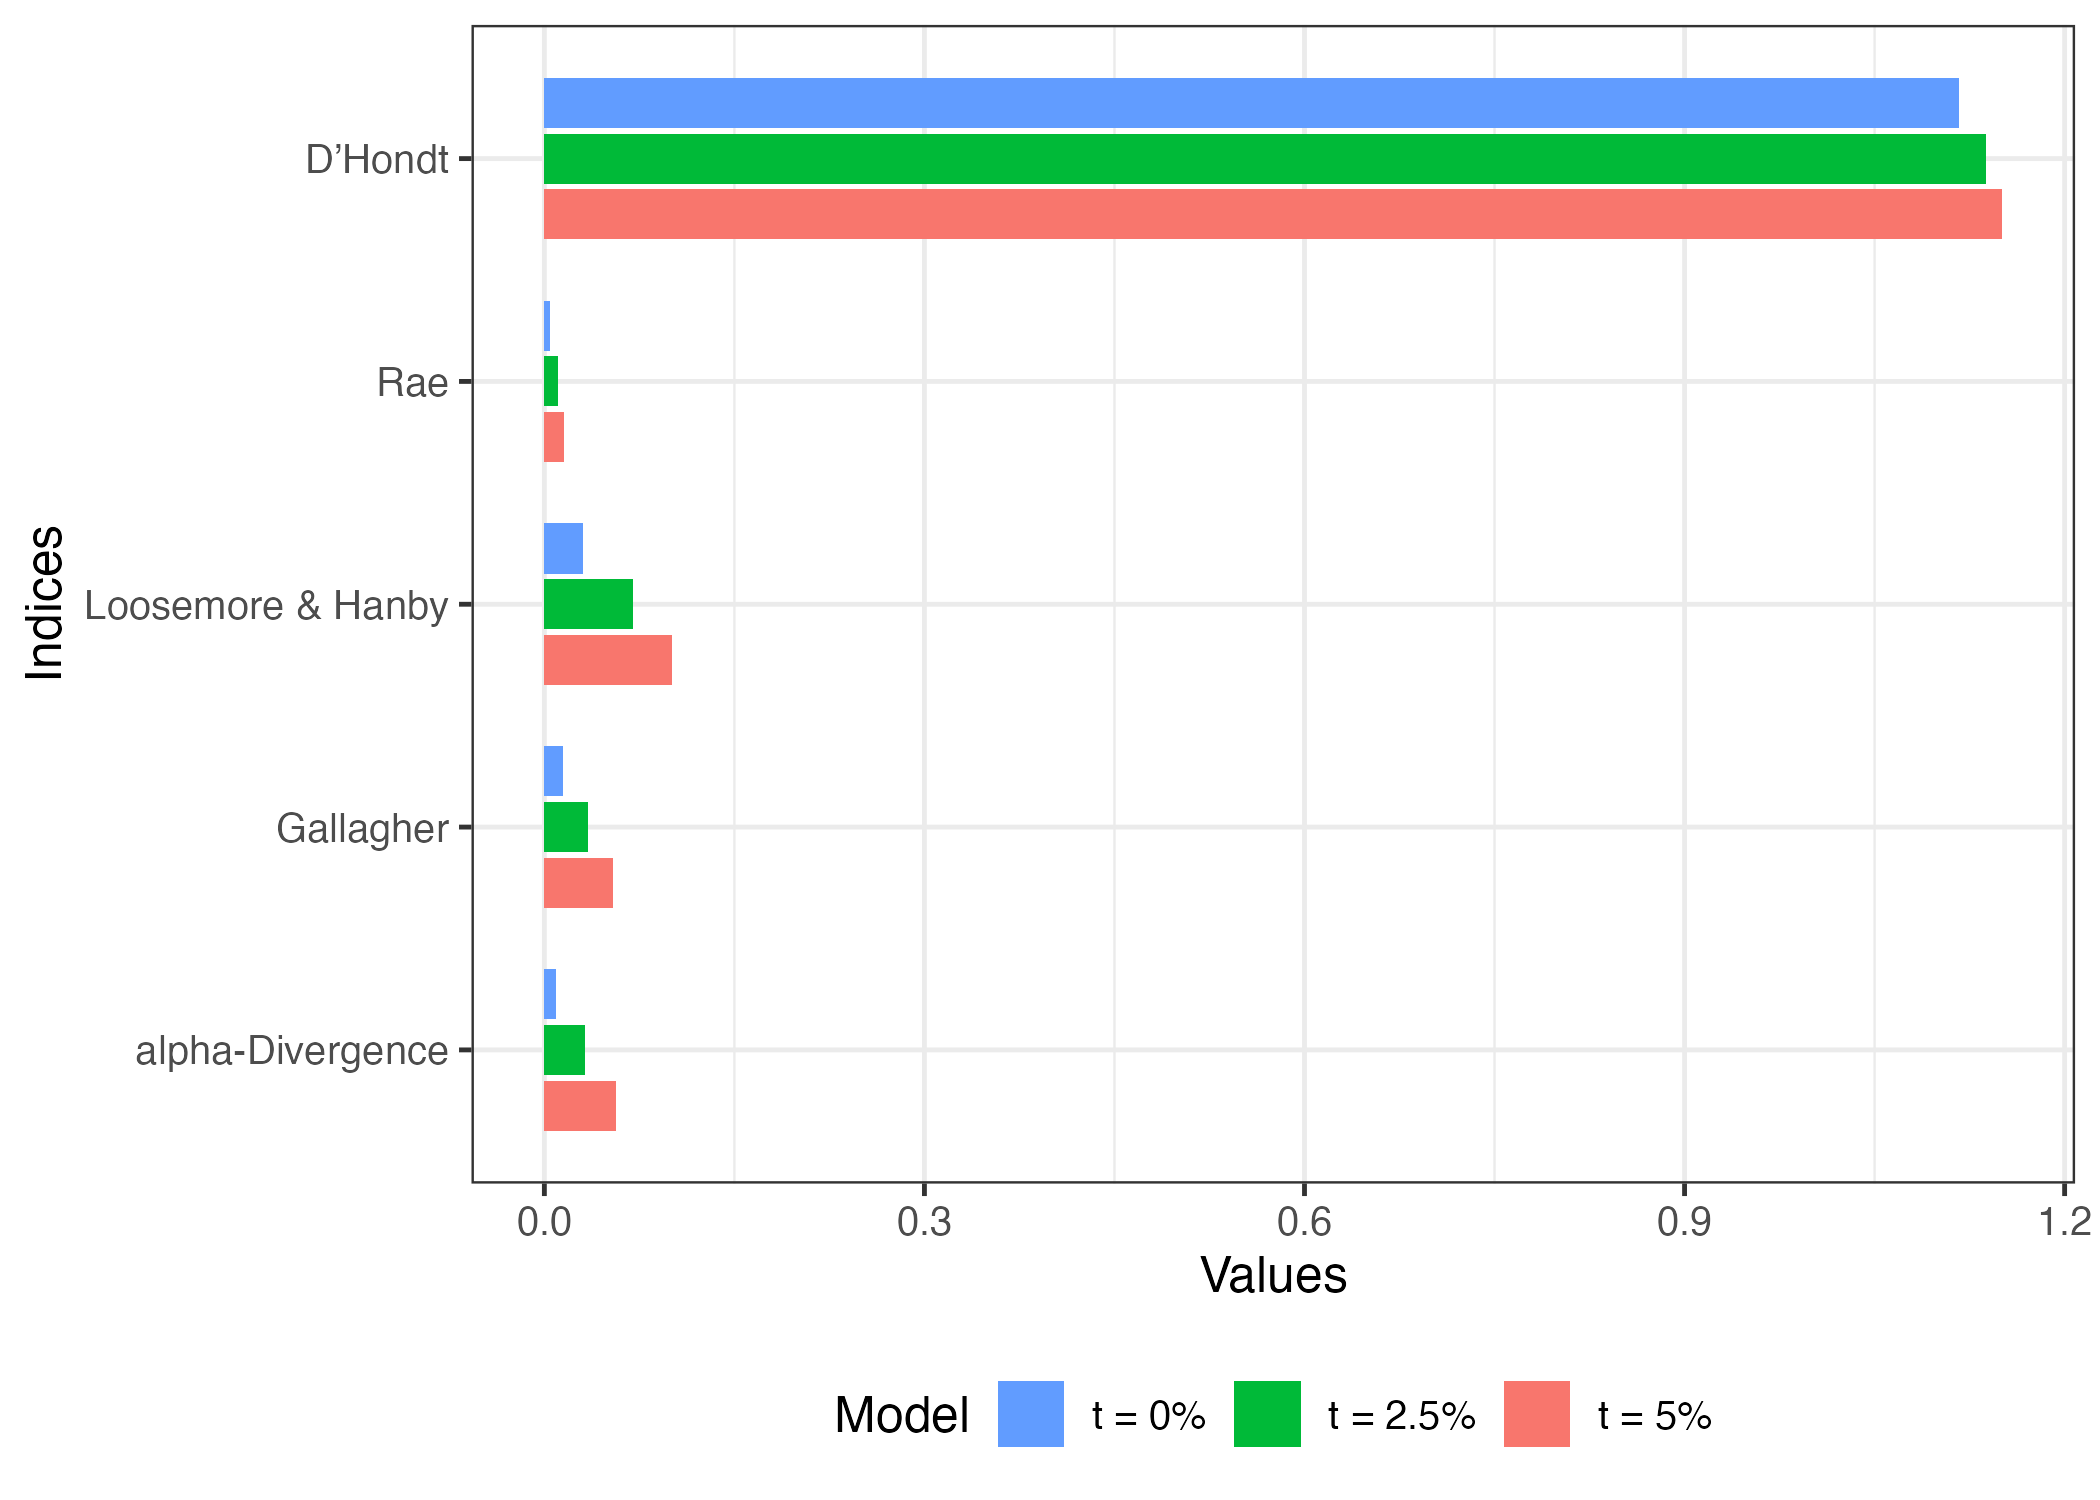
list("t = 0%"   = index(pr_obj1),
     "t = 2.5%" = index(pr_obj2),
     "t = 5%"   = index(pr_obj3)) |>
  compare() |>
  plot(index = c("lh", "gallagher", "rae", "dhondt", "ad"))