Visualization of a prcalc object.

Description

Visualization of a prcalc object.

Usage

## S3 method for class 'prcalc'
plot(
  x,
  type = "both",
  prop = TRUE,
  show_total = TRUE,
  by = c("l1", "l2"),
  subset_l1 = NULL,
  subset_l2 = NULL,
  free_y = FALSE,
  font_size = 12,
  angle = 0,
  facet_col = 4,
  legend_pos = "bottom",
  ...
)

Arguments

x a prcalc object.
type a plot of votes (“raw”), allocation (“dist”), or both (“both”). Default is “both”.
prop Output at a percentage. If type is “both”, it is ignored. Default is TRUE.
show_total If TRUE, a facet names "Total" is diplayed. Default is TRUE.
by Facets by level 1 (“l1”) or level 2 (“l2”). Default is “l1”.
subset_l1 a character vector. a subset of level 1.
subset_l2 a character vector. a subset of level 2.
free_y If FALSE, y-axes are fixed over all facets. Default is TRUE.
font_size a font size.
angle an angle of x-ticks label (0 to 90). Defualt is 0.
facet_col a number of columns of facets.
legend_pos a position of legend. Default is “bottom”
Ignored

Value

A ggplot object.

Examples

library(PRcalc)

data(jp_upper_2019)
data(jp_lower_2021)

pr_obj1 <- prcalc(jp_upper_2019, m = 50, method = "dt")
plot(pr_obj1)

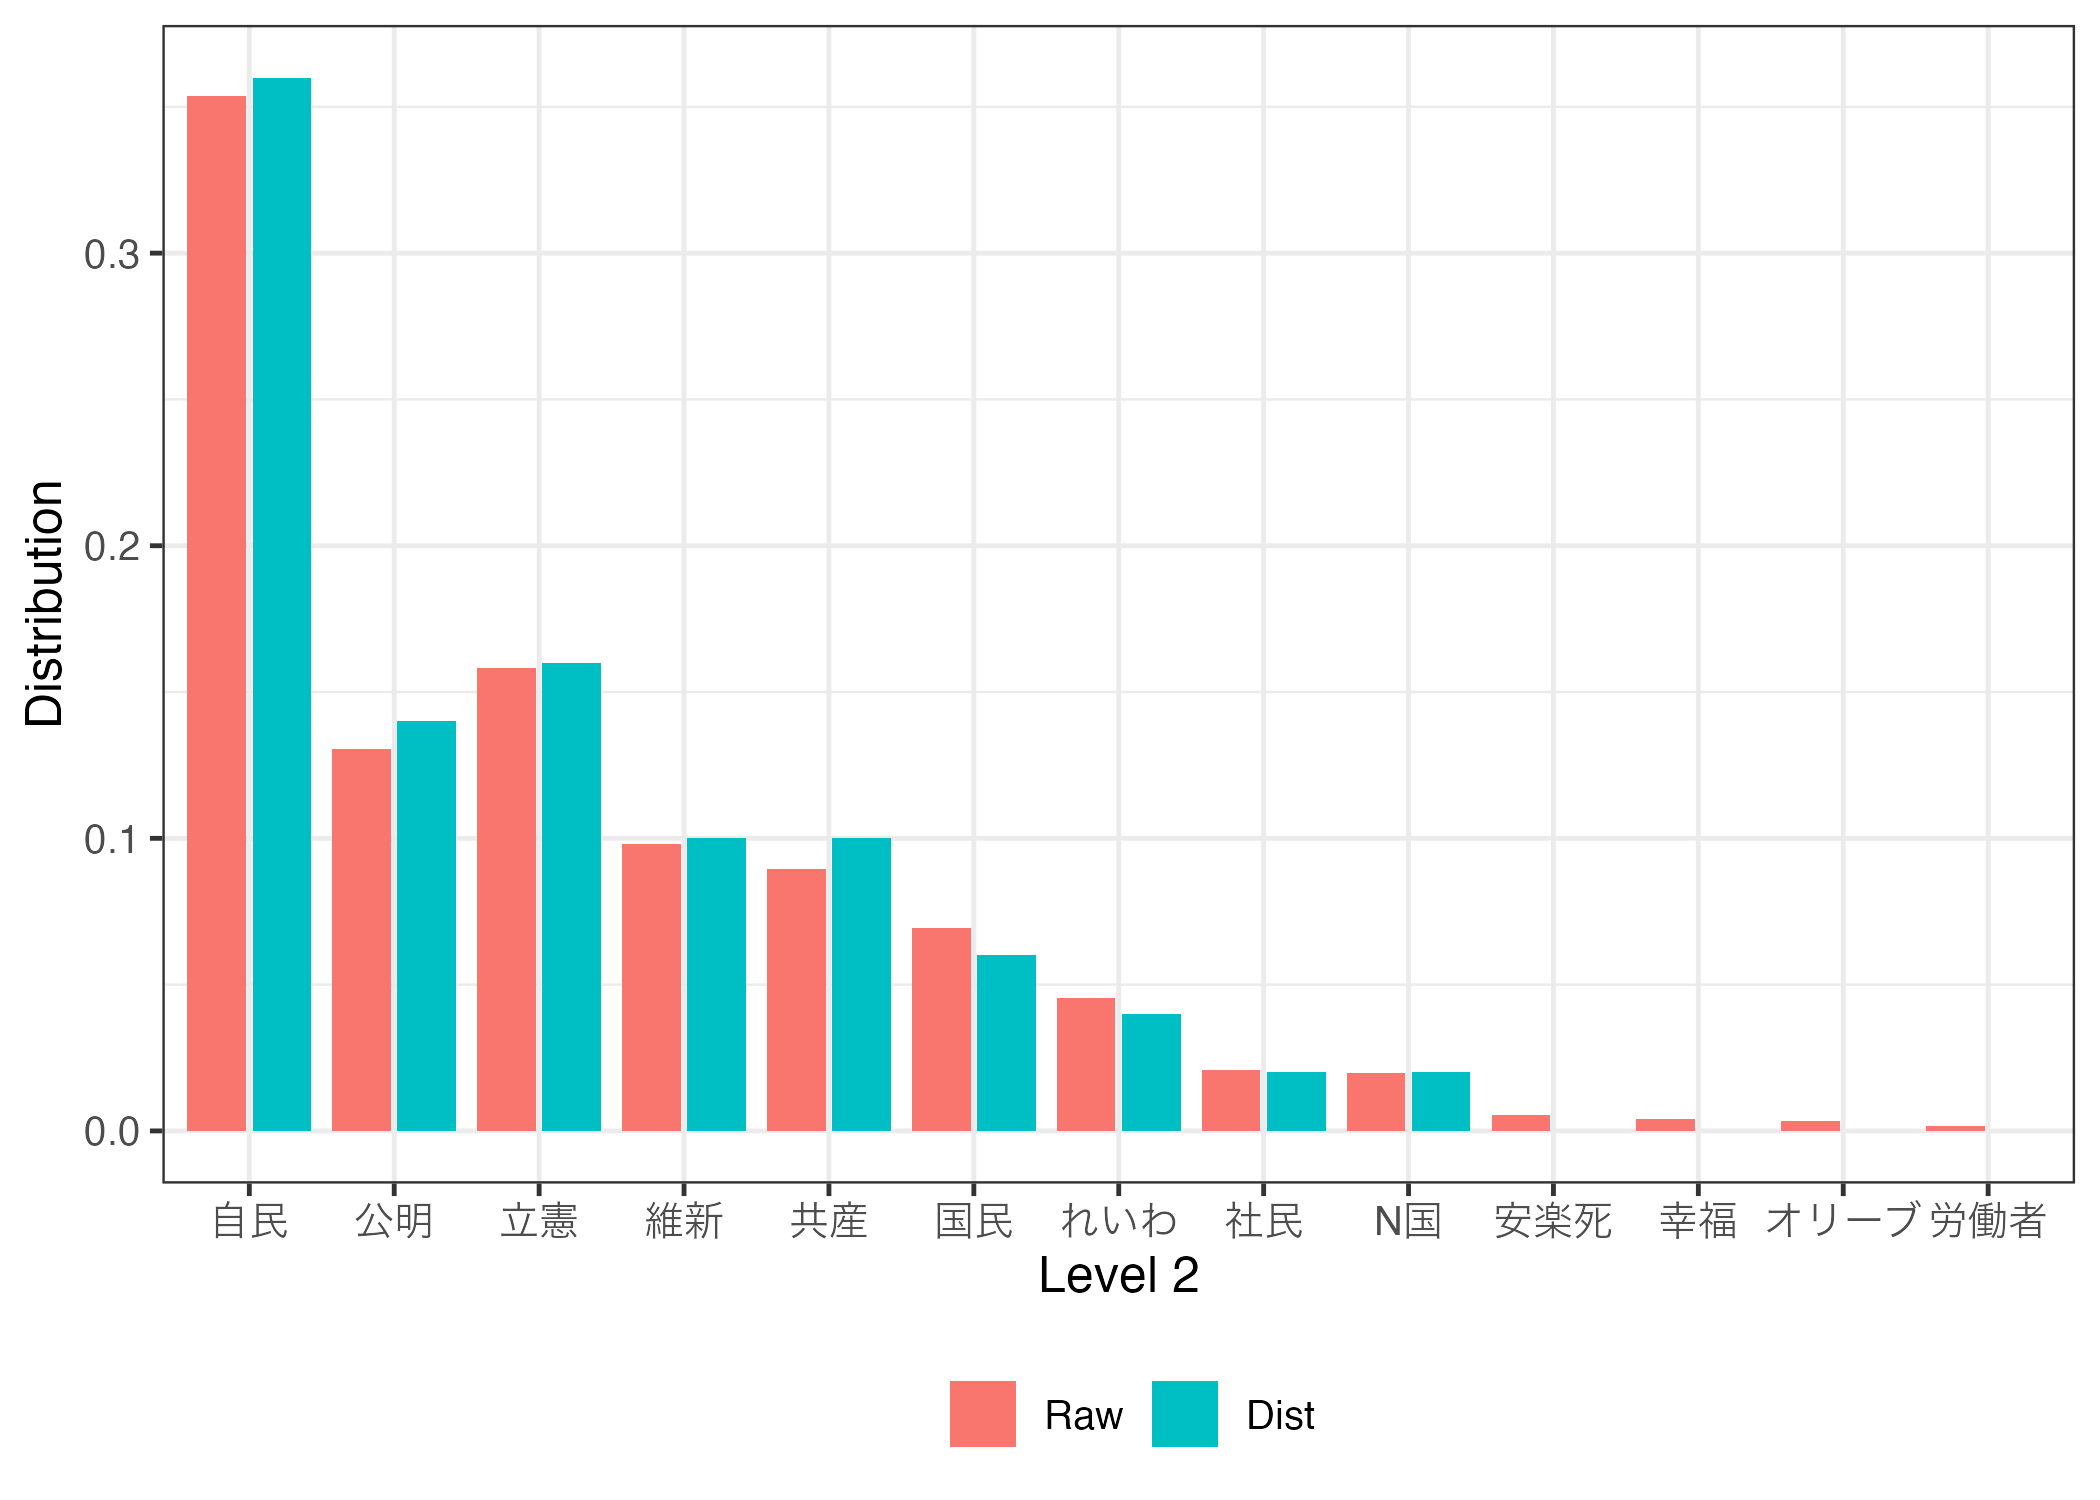
pr_obj2 <- prcalc(jp_lower_2021,
                  m = c(8, 14, 20, 21, 17, 11, 21, 30, 11, 6, 21),
                  method = "hare")
plot(pr_obj2, angle = 90)

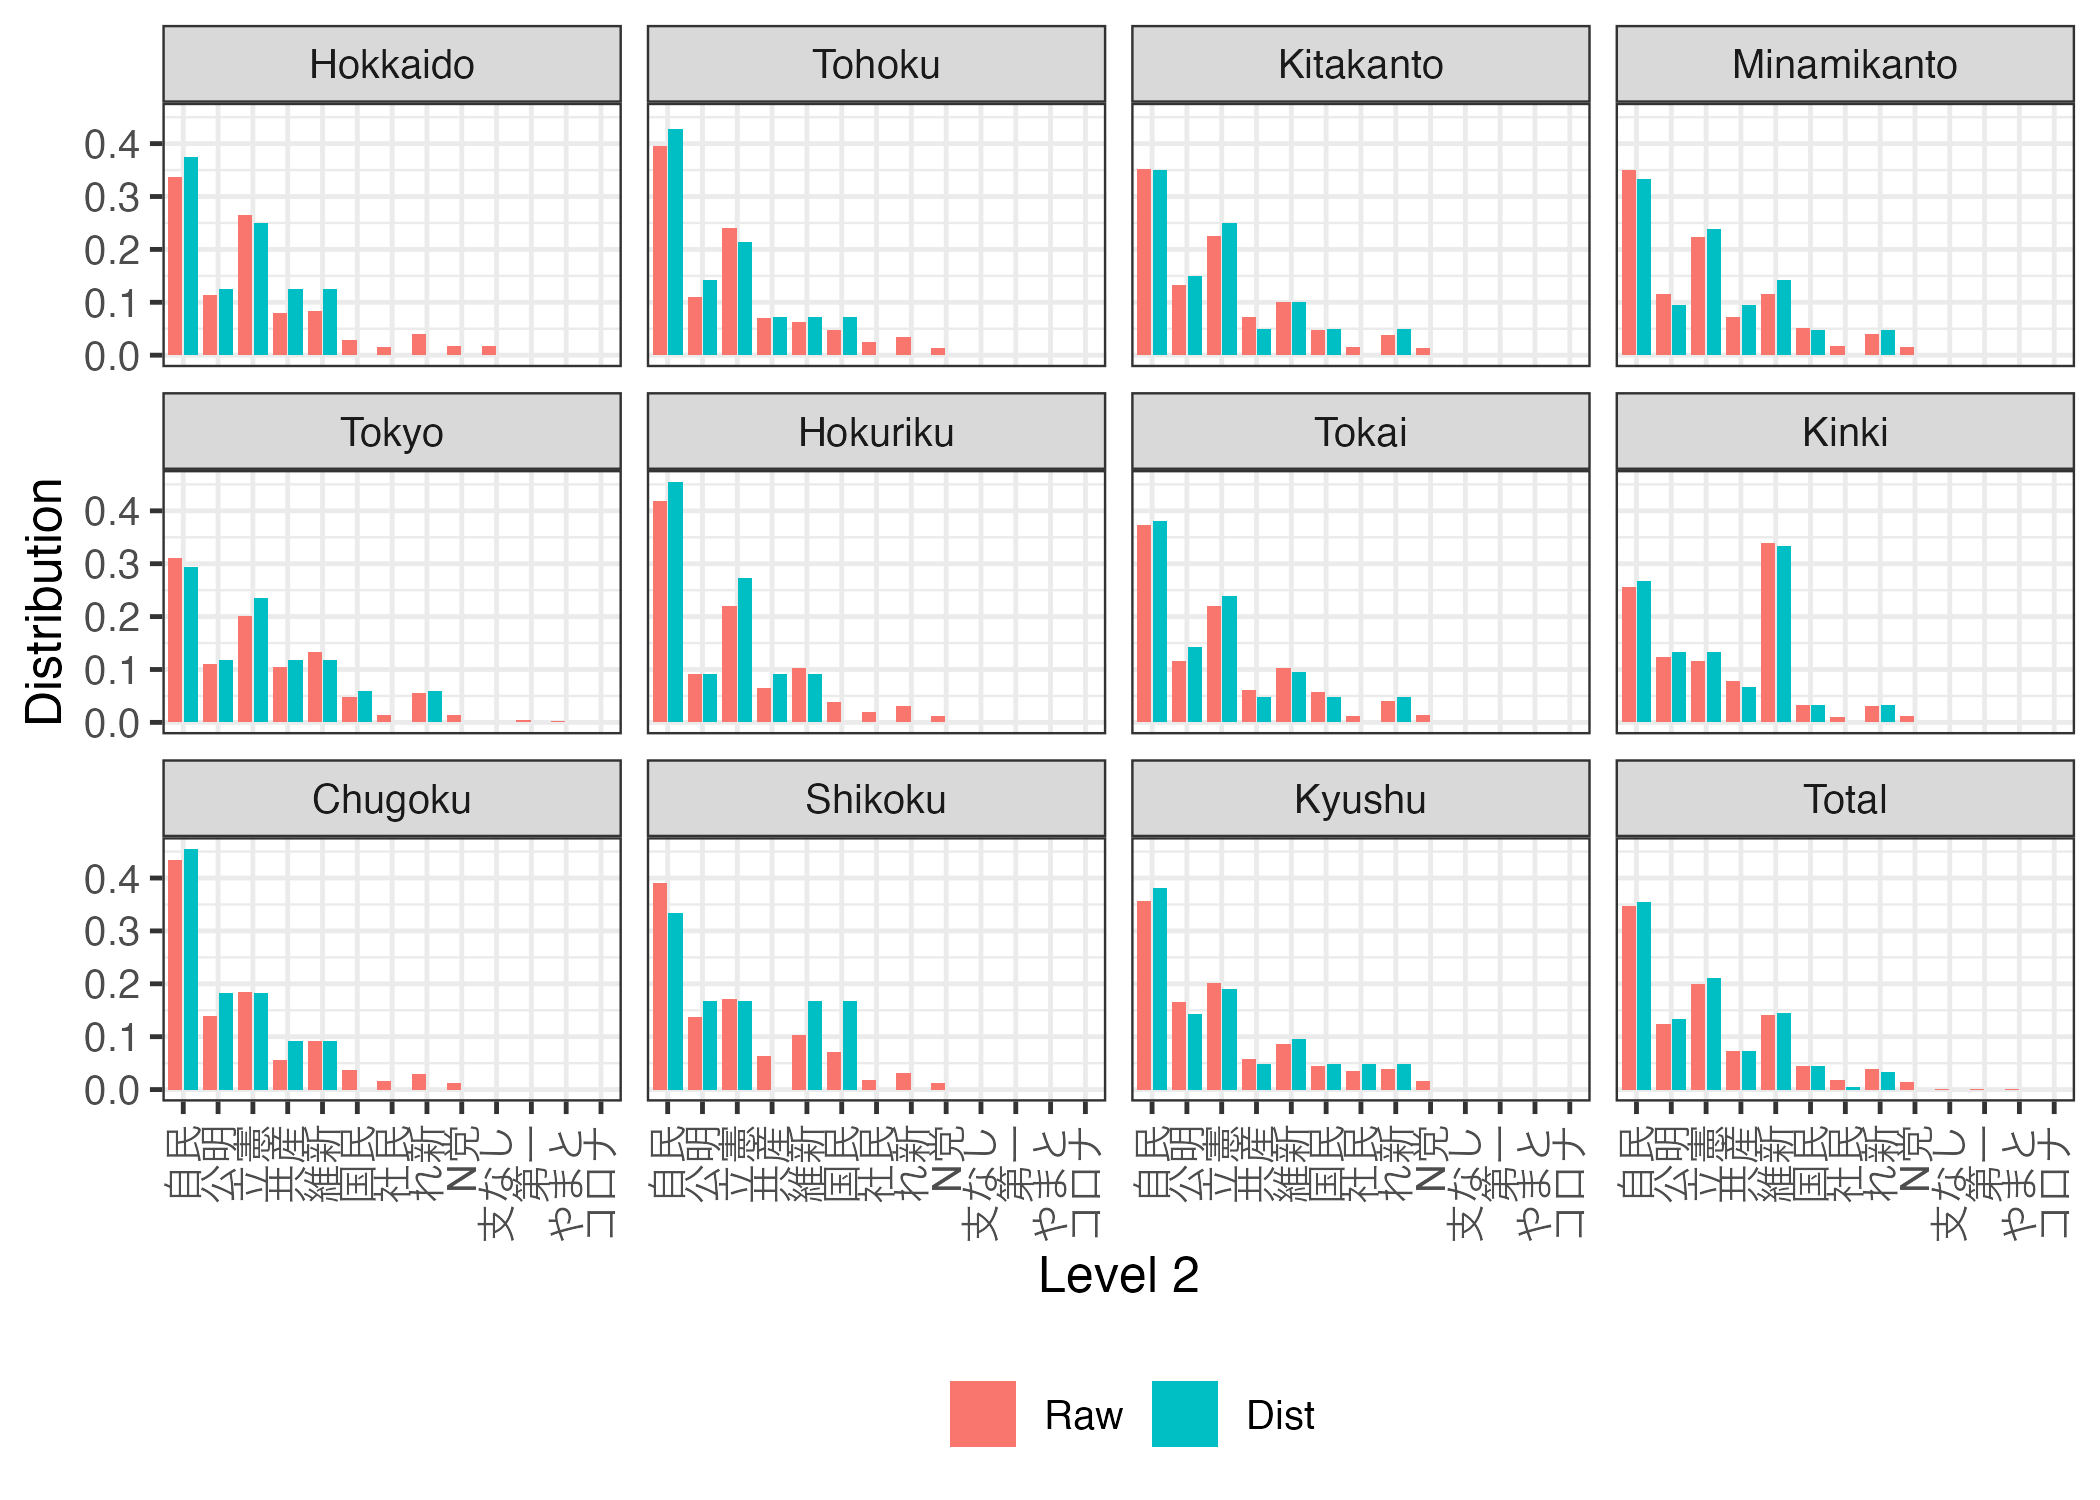
plot(pr_obj2, subset_l2 = c("自民", "公明", "立憲", "維新", "国民"))

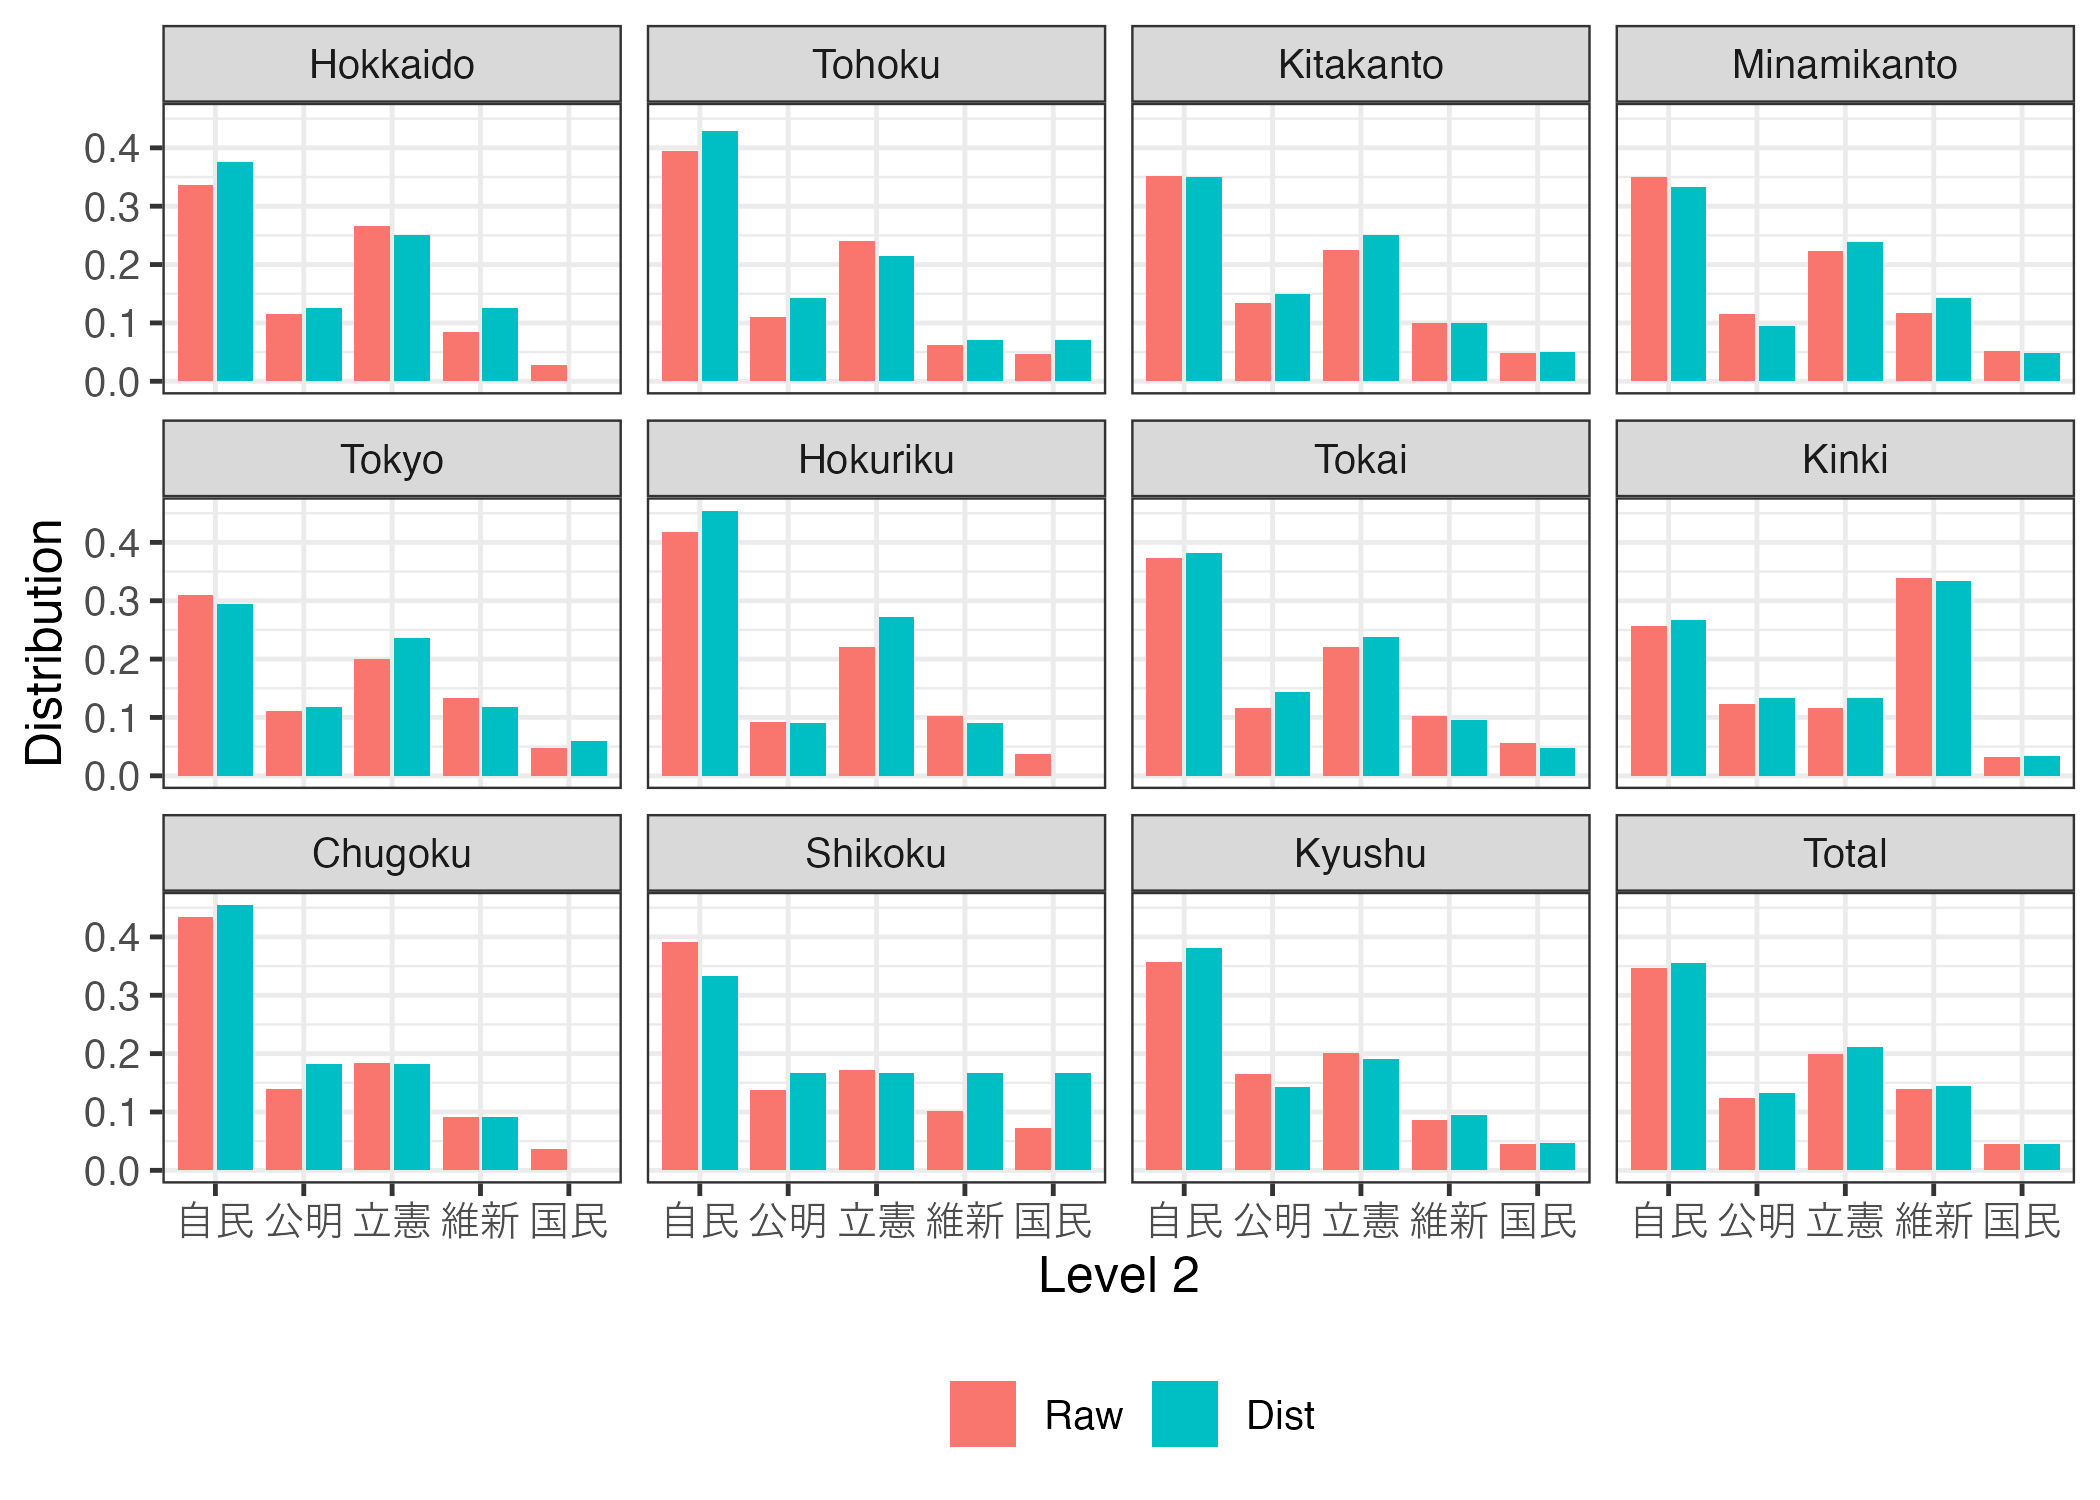
plot(pr_obj2, subset_l1 = c("Tokyo", "Kinki"), facet_col = 1)

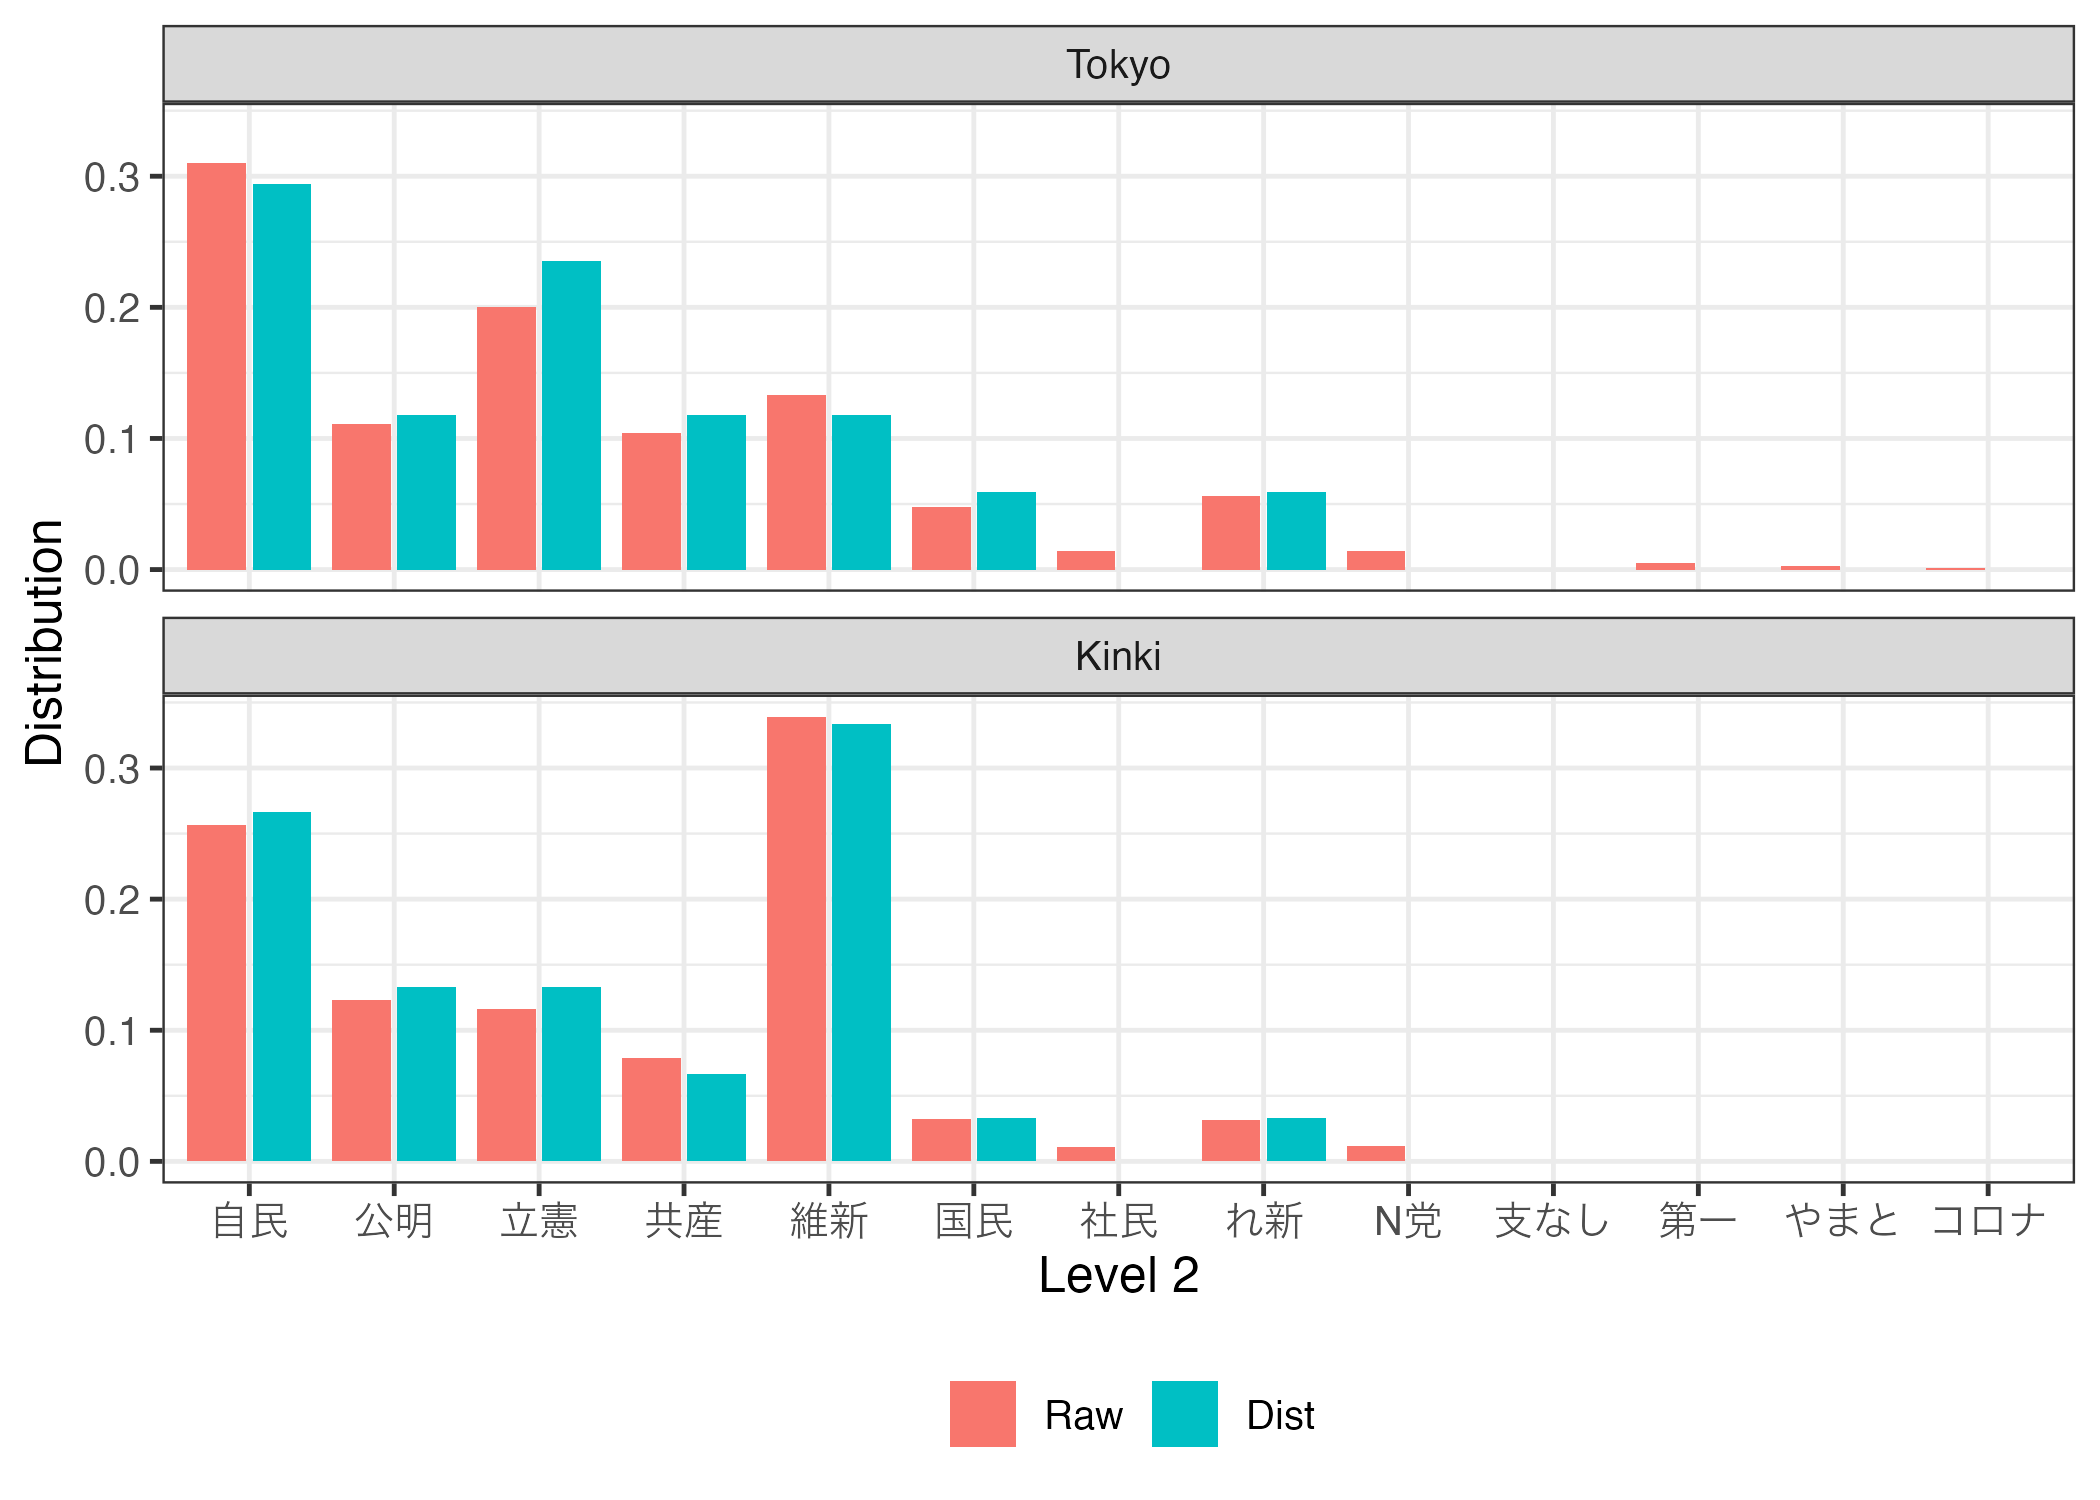
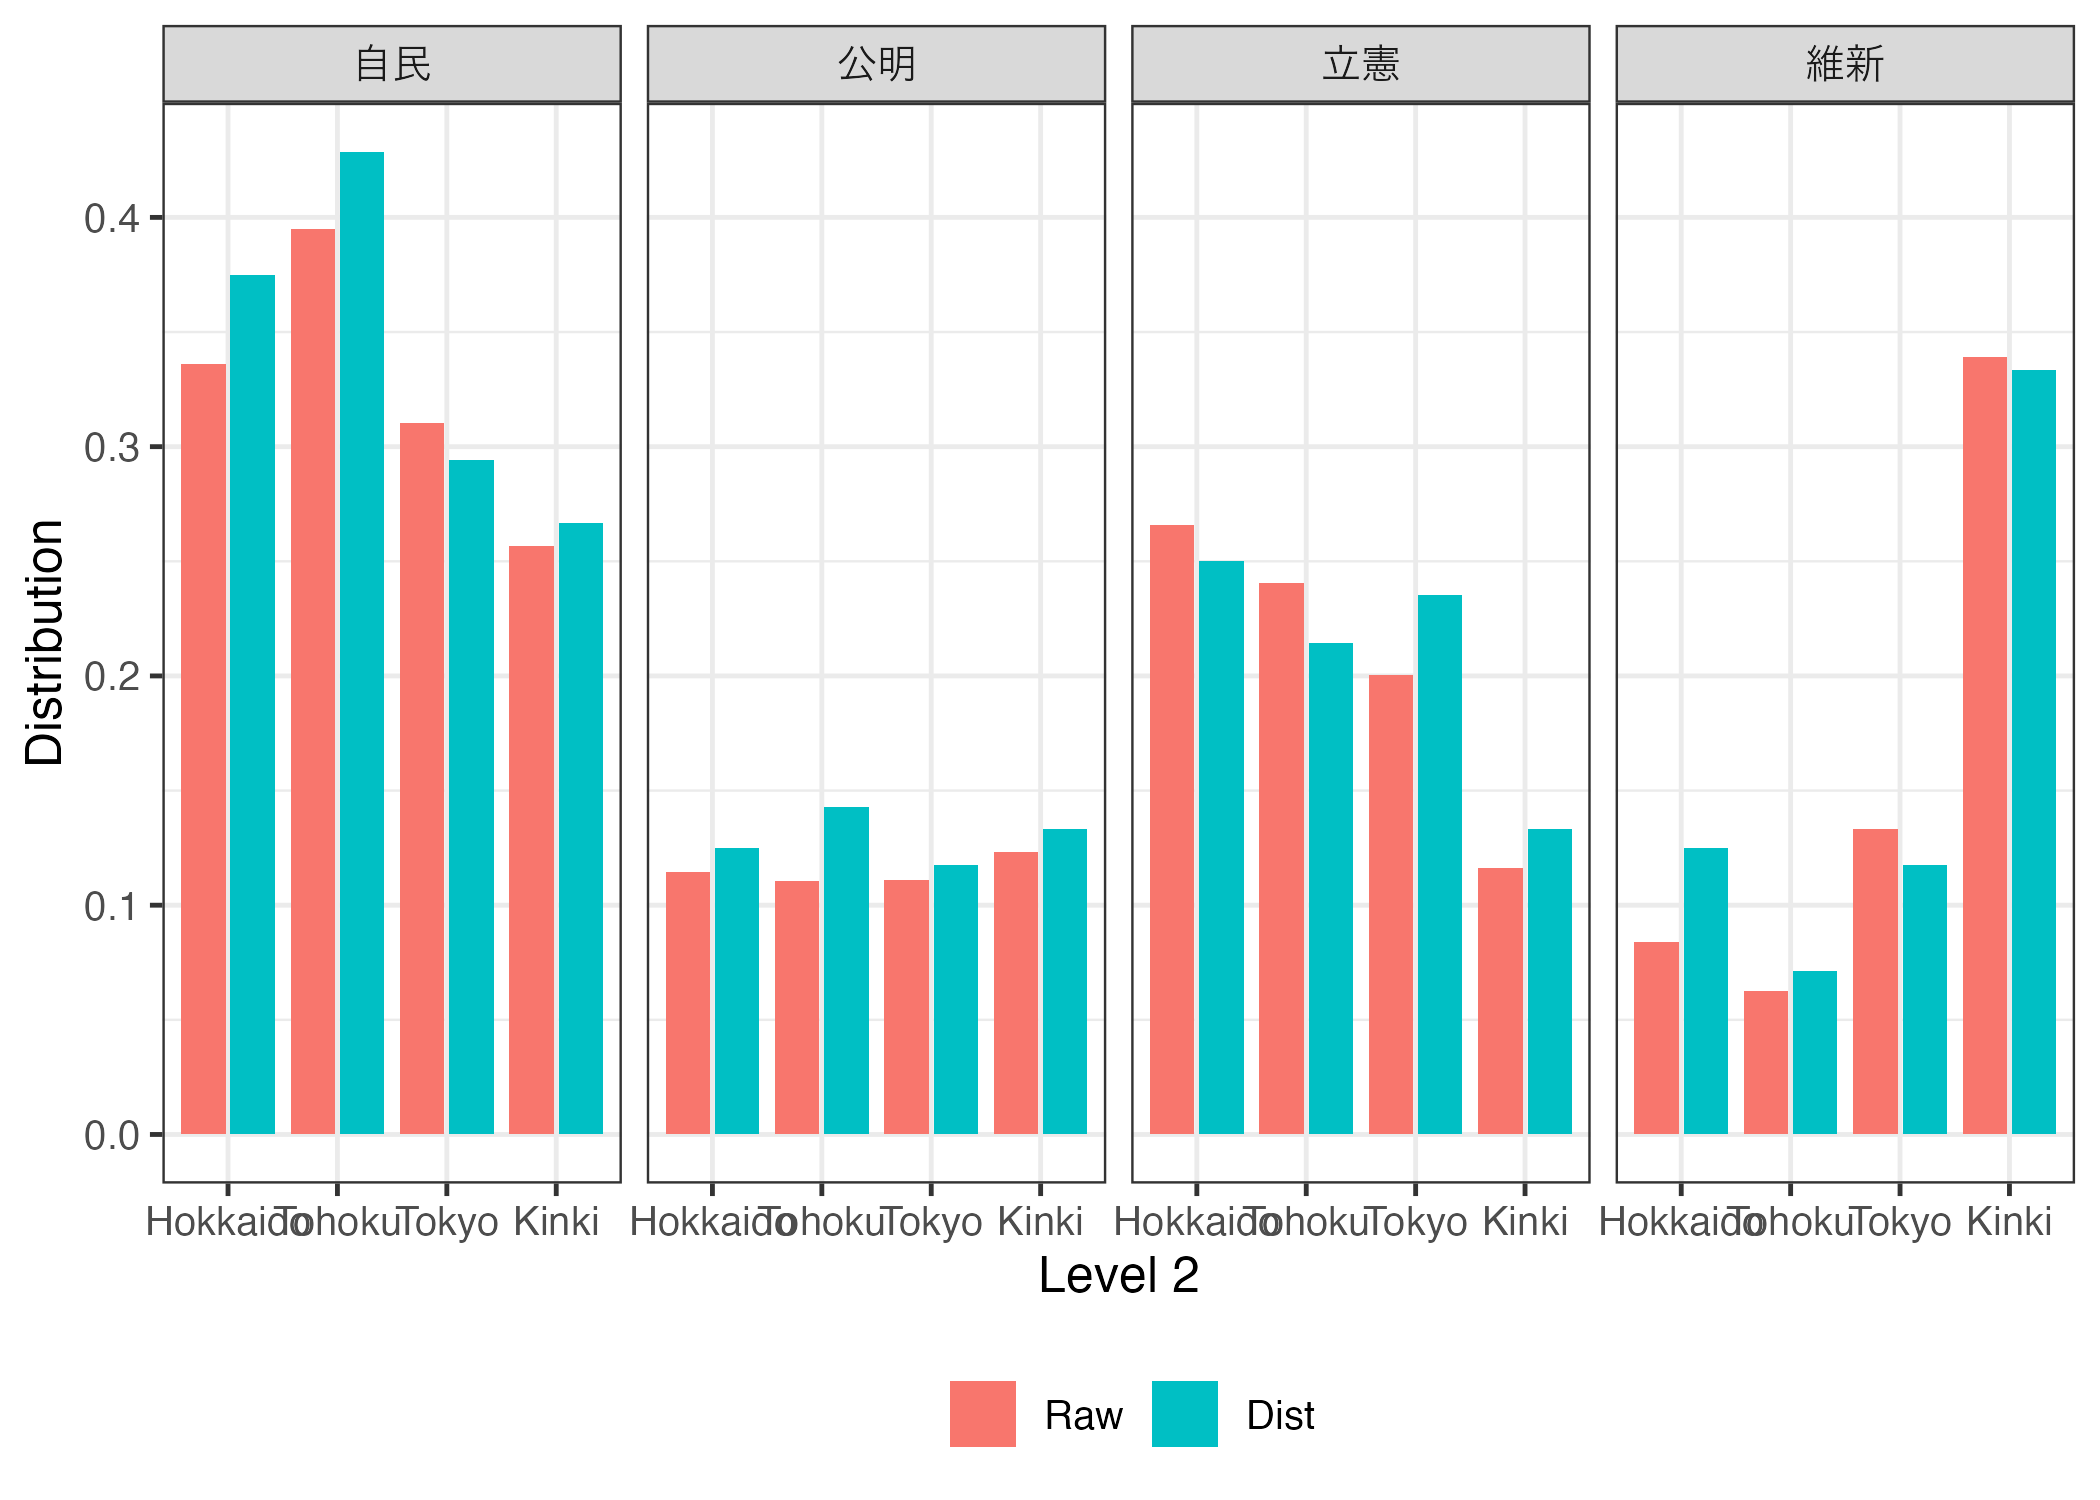
plot(pr_obj2, by = "l2",
     subset_l2 = c("自民", "公明", "立憲", "維新"),
     subset_l1 = c("Hokkaido", "Tohoku", "Tokyo", "Kinki"))