library(PRcalc)
data(jp_upper_2019)
pr_obj <- prcalc(jp_upper_2019, m = 50, method = "dt")
plot(index(pr_obj))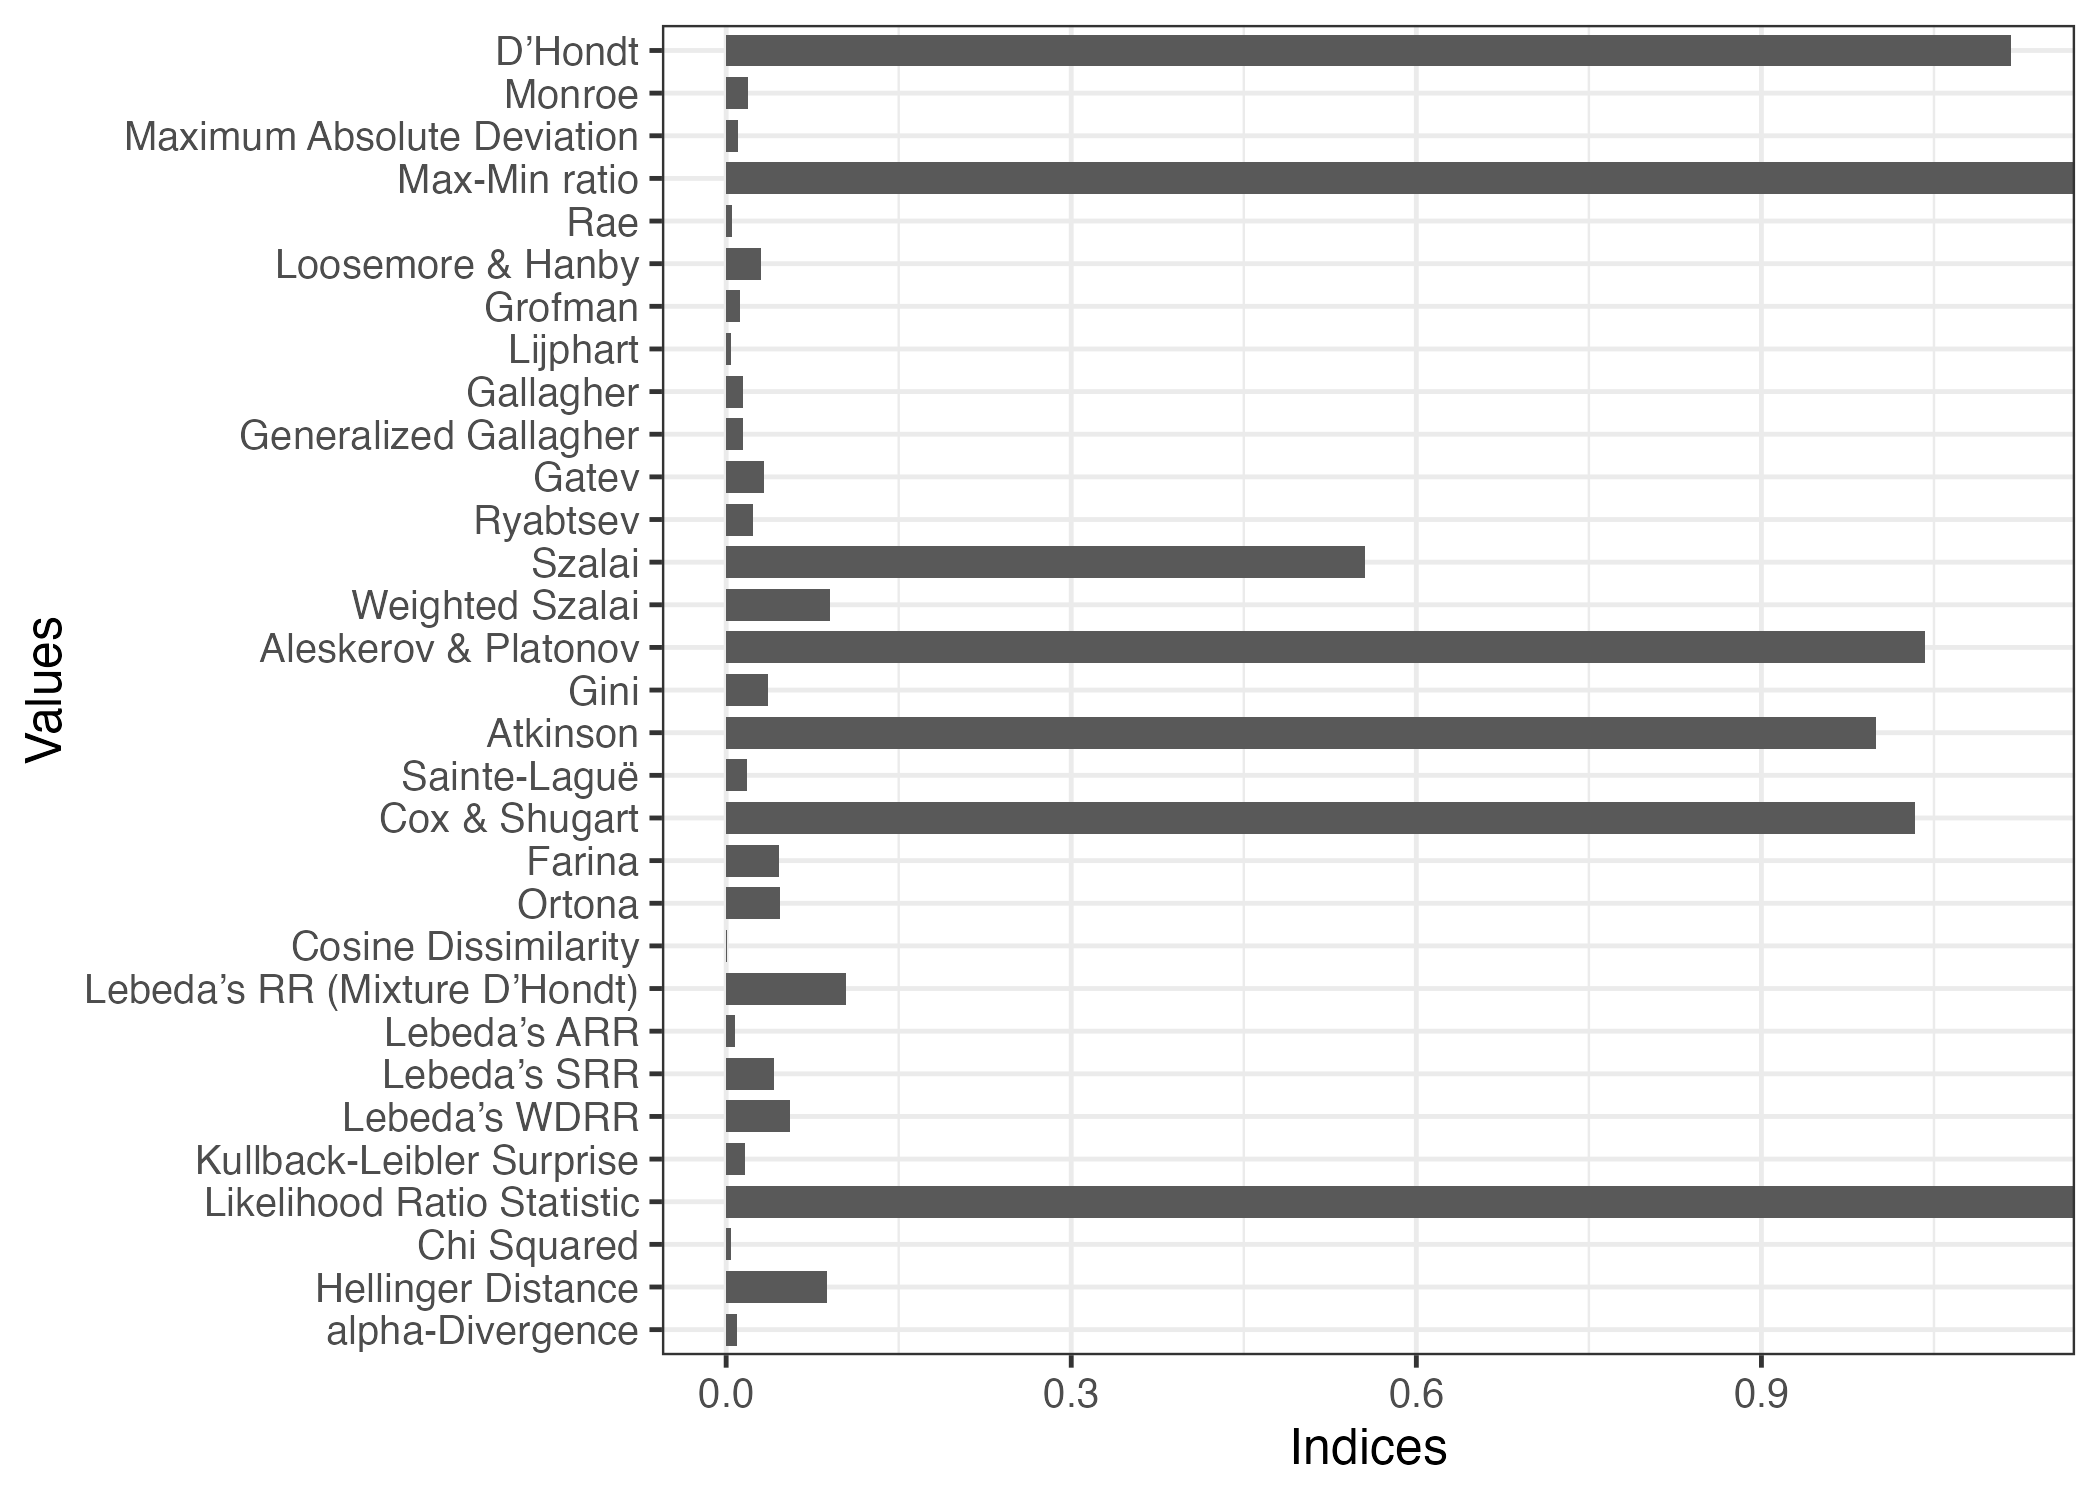
plot(index(pr_obj), style = "lollipop",
index = c("lh", "gallagher", "rae", "dhondt", "ad"))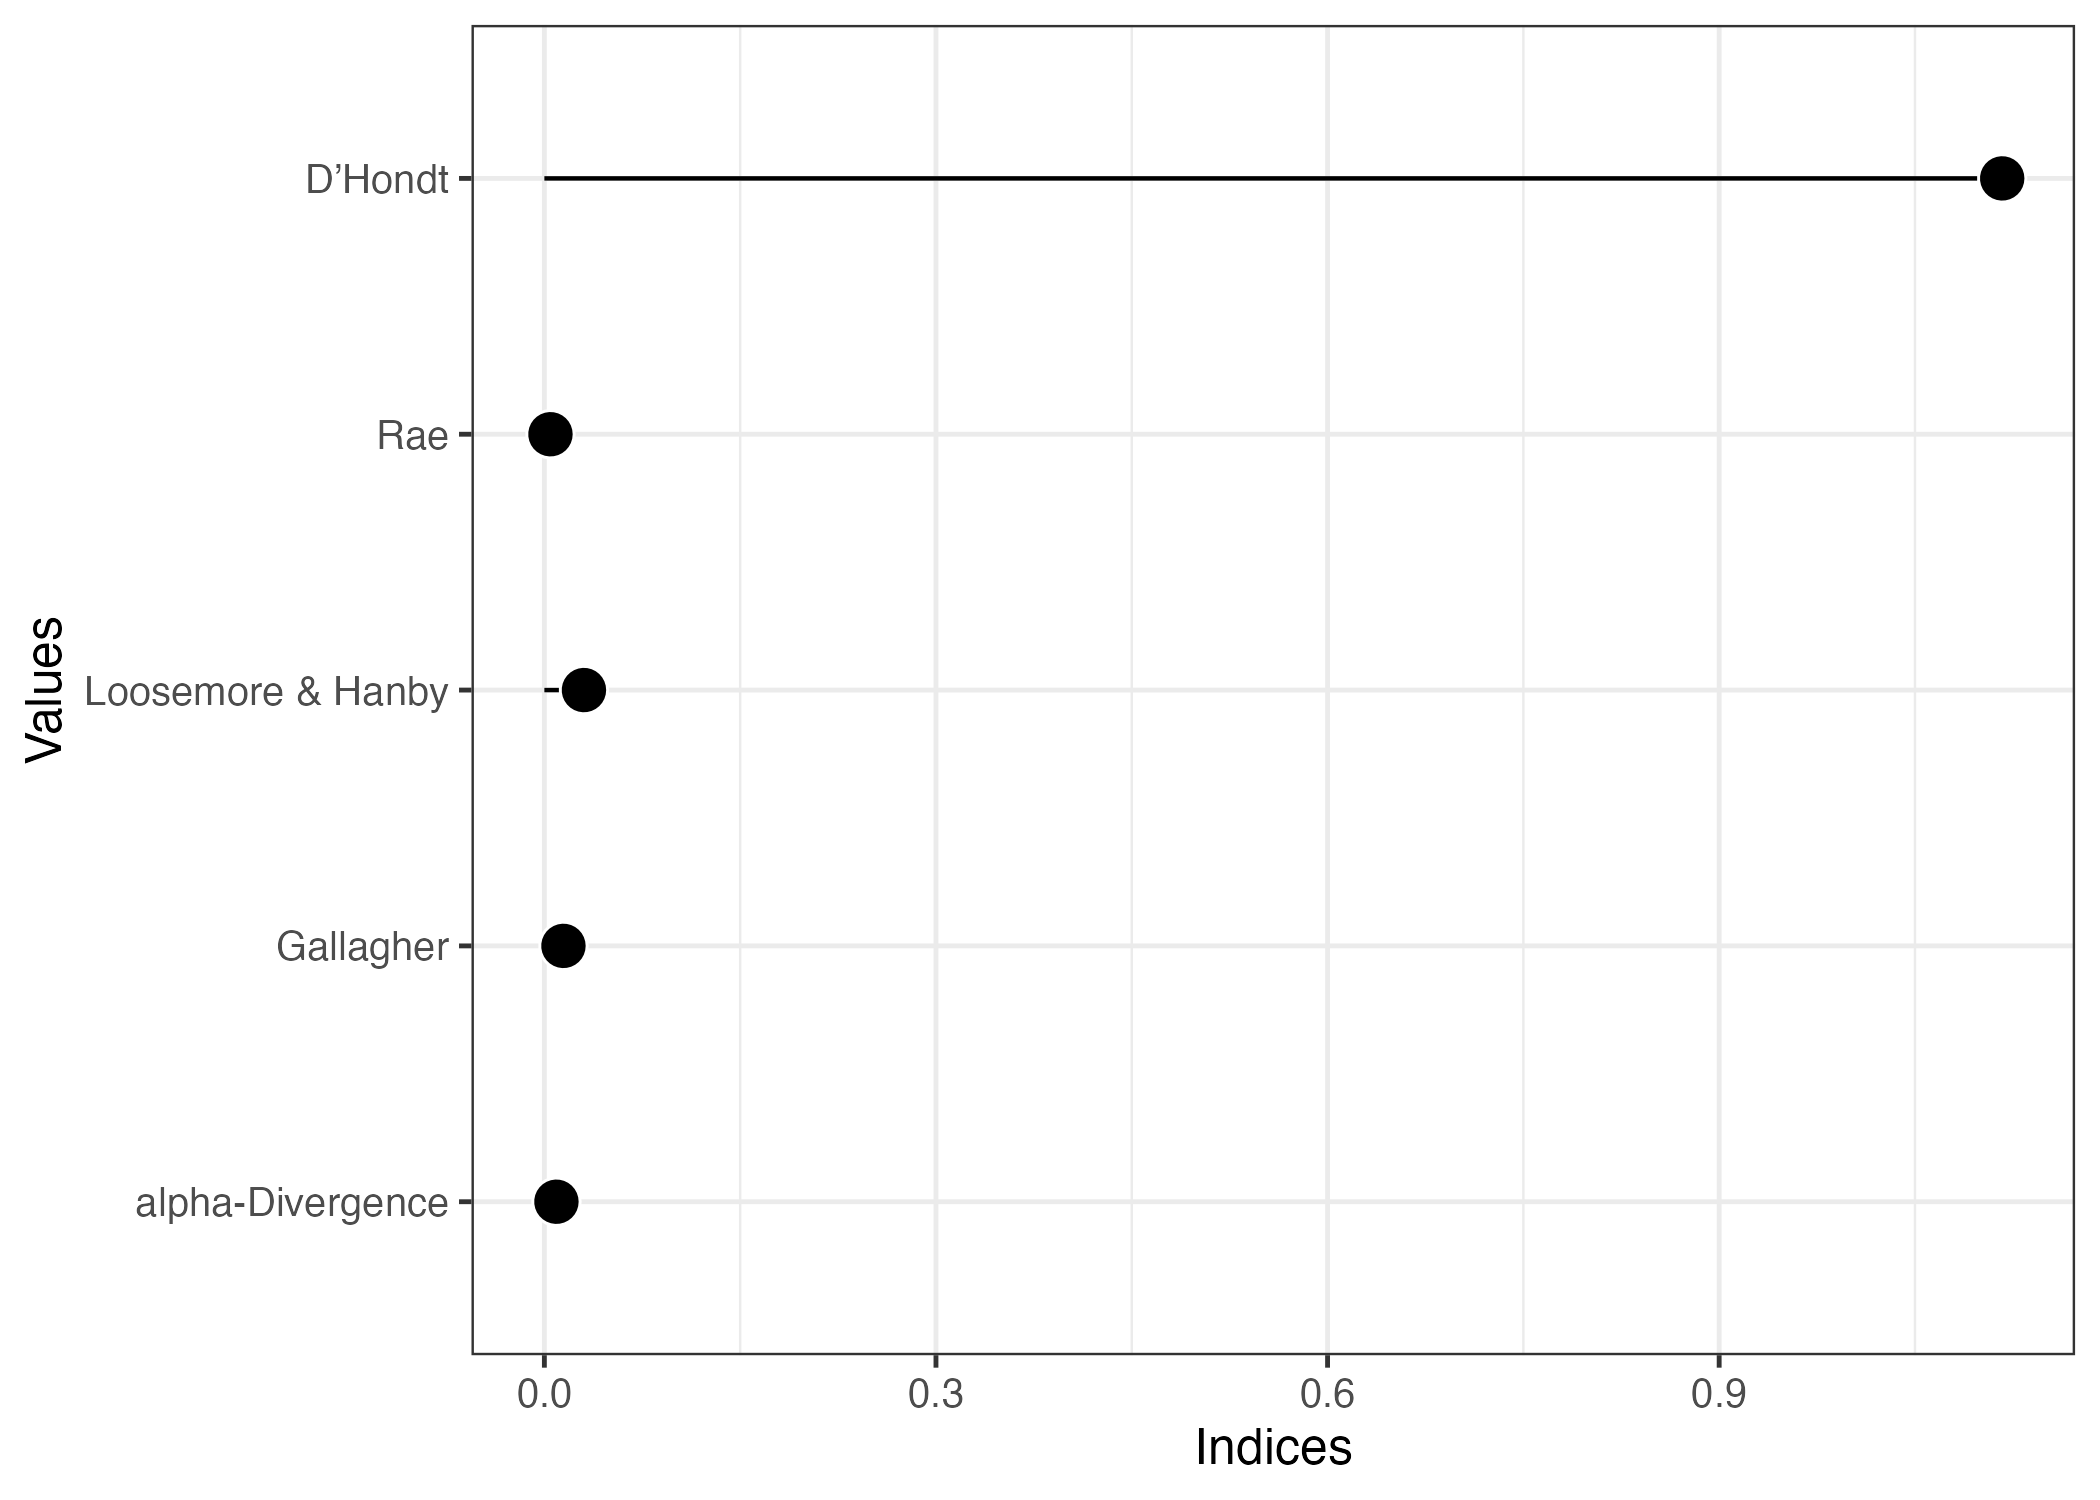
prcalc_index object.Visualization of a prcalc_index object.
## S3 method for class 'prcalc_index'
plot(
  x,
  index = NULL,
  style = "bar",
  bar_width = 0.75,
  point_size = 5,
  font_size = 12,
  ...
)
x
|
a prcalc_index object.
|
index
|
a character vector. A subset of indices. If NULL, all indices are displayed. Default is NULL.
|
style
|
Plot style. Lollipop (“lollipop) or bar plot (”bar”). Default is “bar”.
|
bar_width
|
Default is 0.75.
|
point_size
|
Default is 5.
|
font_size
|
a font size. Default is 12.
|
…
|
Ignored |
A ggplot object.
library(PRcalc)

data(jp_upper_2019)

pr_obj <- prcalc(jp_upper_2019, m = 50, method = "dt")

plot(index(pr_obj))
plot(index(pr_obj), style = "lollipop",
     index = c("lh", "gallagher", "rae", "dhondt", "ad"))